test

Ends in:
test
Skip to content
Scholarsight

IBM SPSS Statistics Foundation Course

Welcome to Quantitative Data Analysis Using IBM SPSS Statistics, a comprehensive course designed to help you develop practical and in-demand skills in statistical data analysis usi...

0 learners
Foundation
Published 2026 · Last updated Jul 2026

IBM SPSS Statistics Foundation Course

lifetime access

Buy now

Course overview

Course Overview

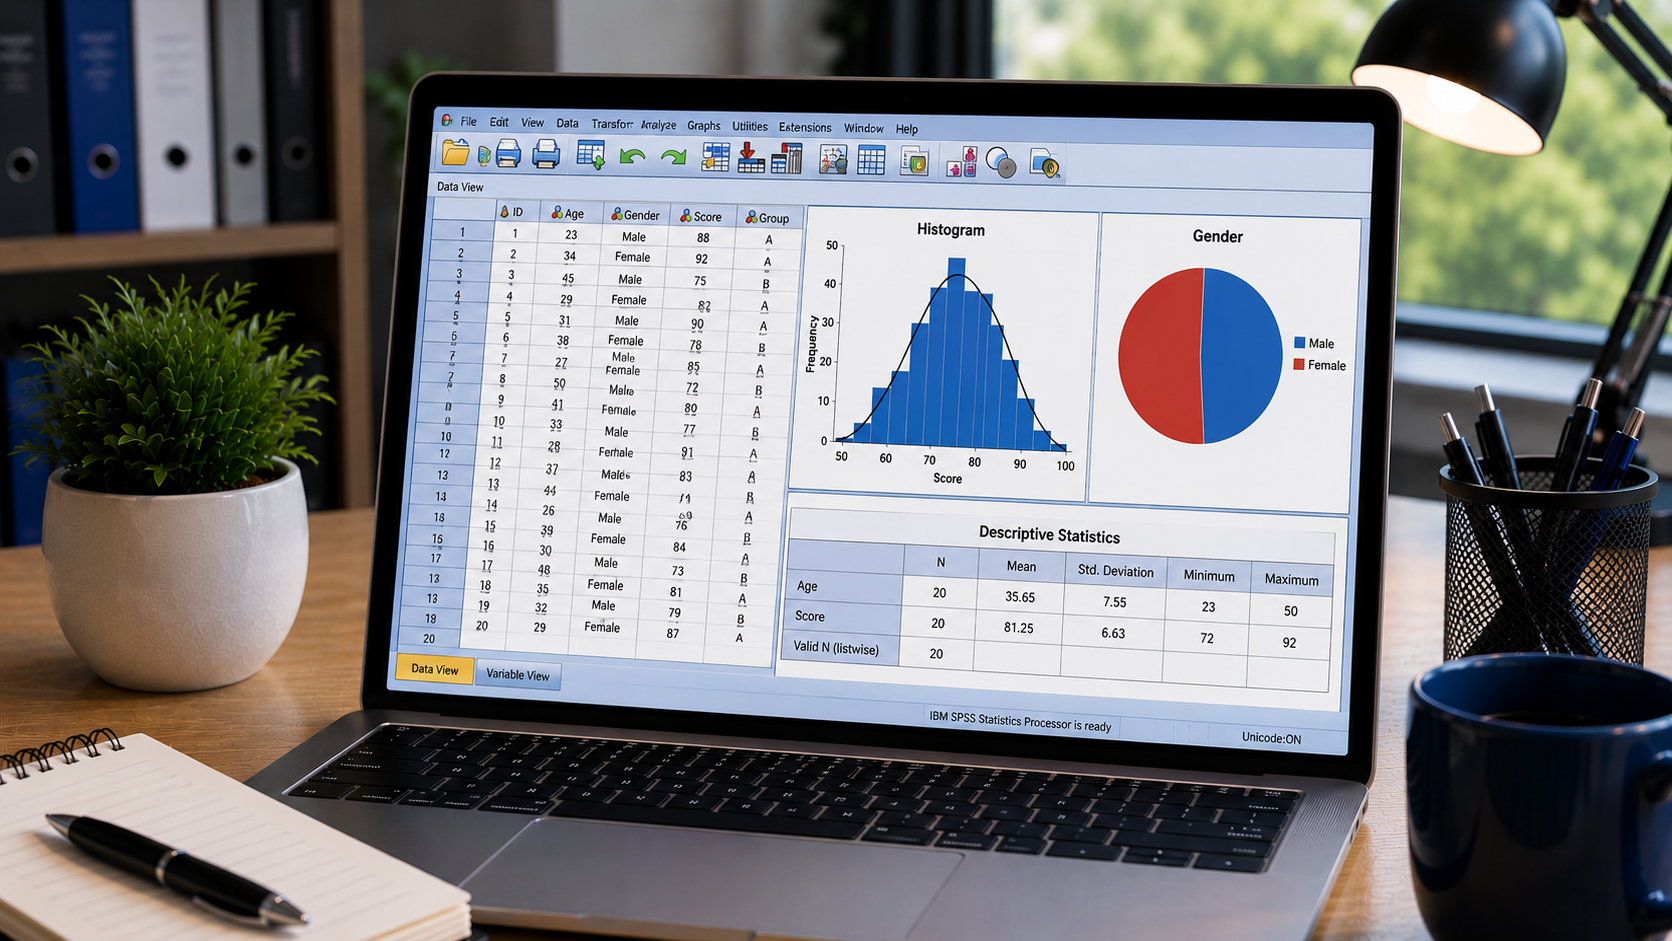
Welcome to Quantitative Data Analysis Using IBM SPSS Statistics, a comprehensive course designed to help you develop practical and in-demand skills in statistical data analysis using one of the world's leading statistical software packages. Whether you are a student, researcher, academic, teacher, or corporate professional, this course provides a structured learning path to build confidence in analyzing quantitative data and interpreting statistical results.


The course covers the complete workflow of quantitative data analysis, from understanding research design and preparing datasets to selecting appropriate statistical techniques, conducting analyses, interpreting outputs, and presenting findings in a professional manner. Through hands-on demonstrations, practical examples, and real-world datasets, you will learn how to use IBM SPSS Statistics to solve research problems, test hypotheses, and generate meaningful insights. The course also emphasizes best practices for reporting statistical findings in accordance with accepted academic and professional standards.


By the end of this course, you will possess the knowledge and practical expertise to perform quantitative data analysis confidently using IBM SPSS Statistics, enabling you to undertake research projects, interpret published research, and make data-driven decisions in academic, business, and professional environments.



Learning Outcomes

Analyze quantitative data confidently using IBM SPSS Statistics.

Design and conduct research studies using appropriate statistical techniques.

Select, perform, and interpret a wide range of statistical analyses in SPSS.

Critically understand and interpret statistical results presented in research publications.

Present statistical findings in a professional, accurate, and research-standard format.

What you walk away with

Career Map & Skills You Gain

Every course adds to three macro skills. Log in to swap platform averages for your own numbers.

Financial skills

62th

percentile

Your salary vs. learners in these roles

After this course+14 pts → 76th

Data Analysis and Research specialist

72% course score

+7

Project contributor

66% course score

+7

Independent practitioner

61% course score

+6

Employability skills

71th

percentile

Quiz scores from the courses you finish

After this course+18 pts → 89th

Analyze quantitative data confidently using IBM SPSS Statistics

64% course score

+6 pts

Design and conduct research studies using appropriate statistical techniques

70% course score

+7 pts

Select, perform, and interpret a wide range of statistical analyses in SPSS

76% course score

+8 pts

Critically understand and interpret statistical results presented in research publications

82% course score

+8 pts

Life skills

48th

percentile

Life-skill test scores after each course

After this course+11 pts → 59th

Critical thinking

76% course score

+8 pts

Decision-making

71% course score

+7 pts

Confidence

68% course score

+7 pts

Curriculum

10 modules · 66 lessons · 4 hr 43 min

Each module pairs the hand calculation with the same analysis in Excel, SPSS, R and Python.

About Instructor
Dataset and Resources
1:03
Quantitative Method Articles
9:12
Article on Philosophy of Research
0:41
Articles with Fascinating Research Ideas
1:12
Downloading and Installing SPSS on Windows
9:53
Installing SPSS GradPack
1:12
SPSS Statistics 26
5:21
SPSS Statistics 28
12:02
Definition and Type of Statistics
2:56
Parametric vs Non-Parametric Statistics and Their Assumptions
9:38
Conceptualizing Variables IV, DV, Control, Moderators & Mediating Variables
7:00
Variable Type Numeric Defining Names, Width, Decimal & Labels for Variables
5:52
Variable Type Comma & Dot
5:12
Variable Type Scientific Notation
2:10
Variable Type Date and Time Stamps
2:43
Variable Type Dollar
1:03
Variable Type Custom Currency
4:11
Variable Type String
1:44
Variable Type Restricted Numeric
3:05
Defining Values & Labels
3:29
Defining Missing Values Discrete, Range & System-Missing Values
4:34
Setting Columns & Alignment
2:33
Defining Scales of Measurement
10:51
Types of Data Files in SPSS Statistics
11:20
Importing an Excel data file in SPSS
5:26
Opening a Comma Separated or CSV file type in SPSS
7:25
Dataset for Recode Function
0:17
COMPUTE VARIABLE function
1:51
Calculating Total using COMPUTE function
8:35
Exercise: Try COMPUTE using IF
1:26
Exercise Solution: COMPUTE using IF
2:19
Recode Function: When to Recode?
6:31
Why We have Two RECODE Functions
1:43
How to RECODE into Different Variable
10:38
COMPUTING Total After RECODE
1:56
RECODE into Same Variable
8:47
Setting Data for Descriptive Analysis
3:08
Types of Descriptive Statistics
6:15
Understanding Three Different Descriptive Tabs in SPSS
5:07
Calculating Frequencies
9:55
Descriptives Analysis Using Crosstab
4:25
Measures of Central Tendency: Mean, Median, Mode
4:07
Calculating and Interpreting Mean, Median & Mode
5:27
Confirming Mode with Frequencies
2:03
Explore Option Calculating Grouped Descriptives
5:10
Explore Option Interpreting Groupwise Mean and 95% Confidence Interval of Mean
2:43
5% Trimmed Mean: Concept, Use & Interpretation
0:56
Explore Median, Standard Deviation, Variance, Minimum, Maximum, & Range
1:49
Quartiles and Inter-Quartile Range using Explore Option
2:37
Calculating & Interpreting Significance Level of Skewness
5:13
Kurtosis Calculation, Interpretation and Understanding Significance Level
3:07
Standard Error of Mean Concept, Calculation & Interpretation
1:33
Independent sample t-test: Defining input options
7:15
Independent sample t-test Interpreting descriptive output (Mean, SD, SE)
3:44
Independent Sample t-test Interpreting Levene's test, t, p, SE and 95% Confidence Interval
APA Style write-up for Independent Sample t-test
3:35
When to use Paired Sample t-test?
2:39
Calculating Paired Sample t-test in SPSS
4:26
Interpreting Paired Sample t-test Output
2:51
APA Style write-up for Paired Sample t-test
2:06
When to Use One-Way ANOVA
1:46
Calculating One-Way ANOVA in SPSS
2:57
Interpreting ANOVA output: Descriptive Statistics
2:55
Interpreting Output: ANOVA Summary Table
3:39
Doing Post-hoc analysis in ANOVA Homogeneity of Variance Test & Post-hoc Tests
5:36
₹1,950 Enroll Now

Reviews

What learners say

You need to have access to this course to write a review

Buy Now
0.0

0 reviews

  • No reviews yet.

Questions

Frequently asked

Who is this course for?

This course is designed for learners who want a practical, guided path through Data Analysis and Research.

What will I learn?

Analyze quantitative data confidently using IBM SPSS Statistics. Design and conduct research studies using appropriate statistical techniques. Select, perform, and interpret a wide range of statistical analyses in SPSS.

How long do I have access?

Your course access remains available for the lifetime of your account, including future updates to the lessons.

Is there a refund?

Yes. Eligible purchases include the platform money-back guarantee described at checkout.

We are committed to your progress

Lifetime access, mentor Q&A on every lesson, and a certificate you can share the moment you finish. If it is not right for you, the first 30 days are on us.

Start this learning path

Course preview

Preview

Loading preview...

Preview Unavailable

Forgot?