scholarsight-logo
  • Login
  • Register
  • Courses
  • Login
  • Register

Table of Contents

        1. Introduction to Advanced Data Visualiza...
        1. What is Meaning of a Distribution?
        2. Advanced data Visualization in SPSS
        3. Creating Frequency and Probability Dist...
        4. Understanding Fat Tail and Thin Tail Di...
        5. Difference between FAT tail and THIN Ta...
        6. PP Plots in SPSS
        7. 1 Many Names of PP Plot
        8. Interpreting PP Plots in reference to t...
        9. What are QQ Plots
        10. Creating and Interpreting QQ Plots in SPSS
        11. How to Use QQ Plot to improve Normality...
        12. Relationship Maps in SPSS

Contents

Advanced Data Visualization in SPSS

0
  • Facebook
  • Twitter
  • LinkedIn
  • Unlock this course with a membership upgrade

    Join today to access 100+ courses taught by industry experts.
    Unlock this course with a membership upgrade
    • SPSS

    Year of Creation: 2017

    Posted Online on: 30 July 2017

    Posted Online on: 05 May 2023

    Duration: 1 Hour 26 Minutes

    Course Description

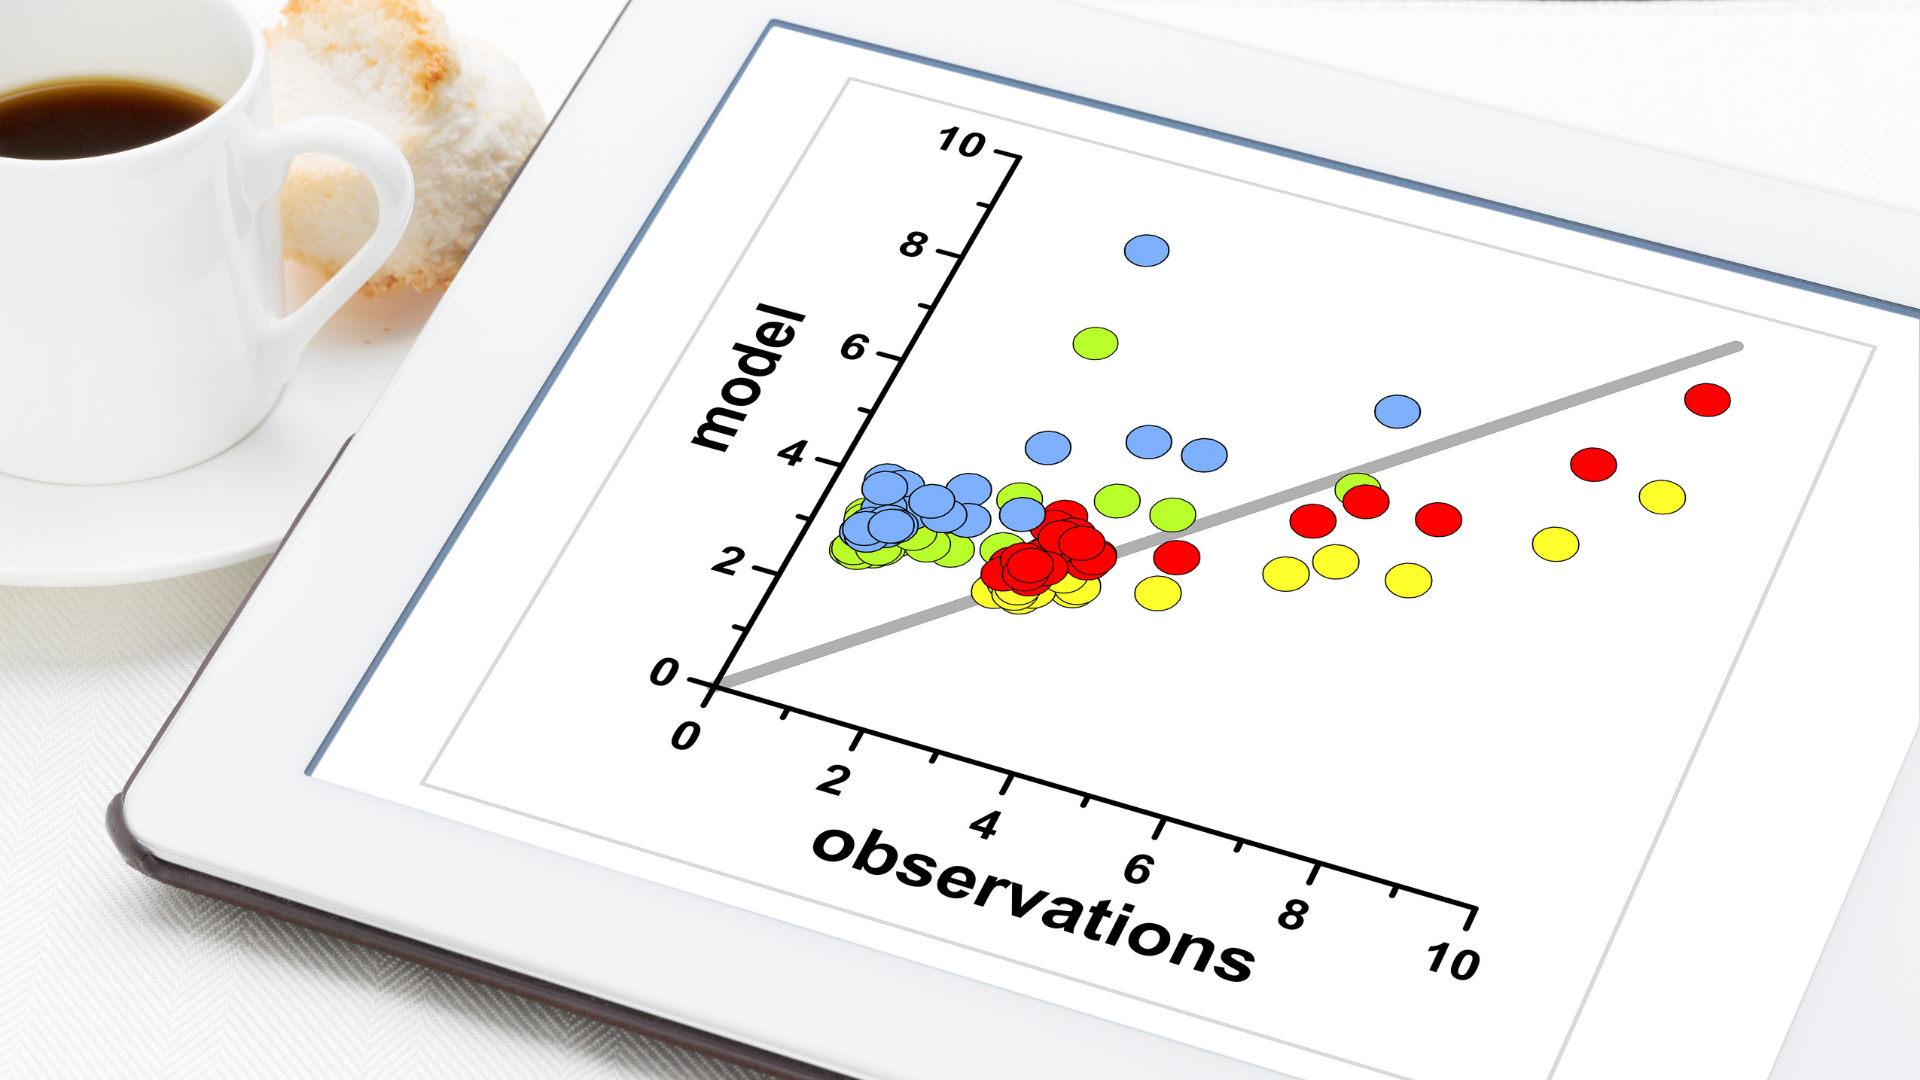
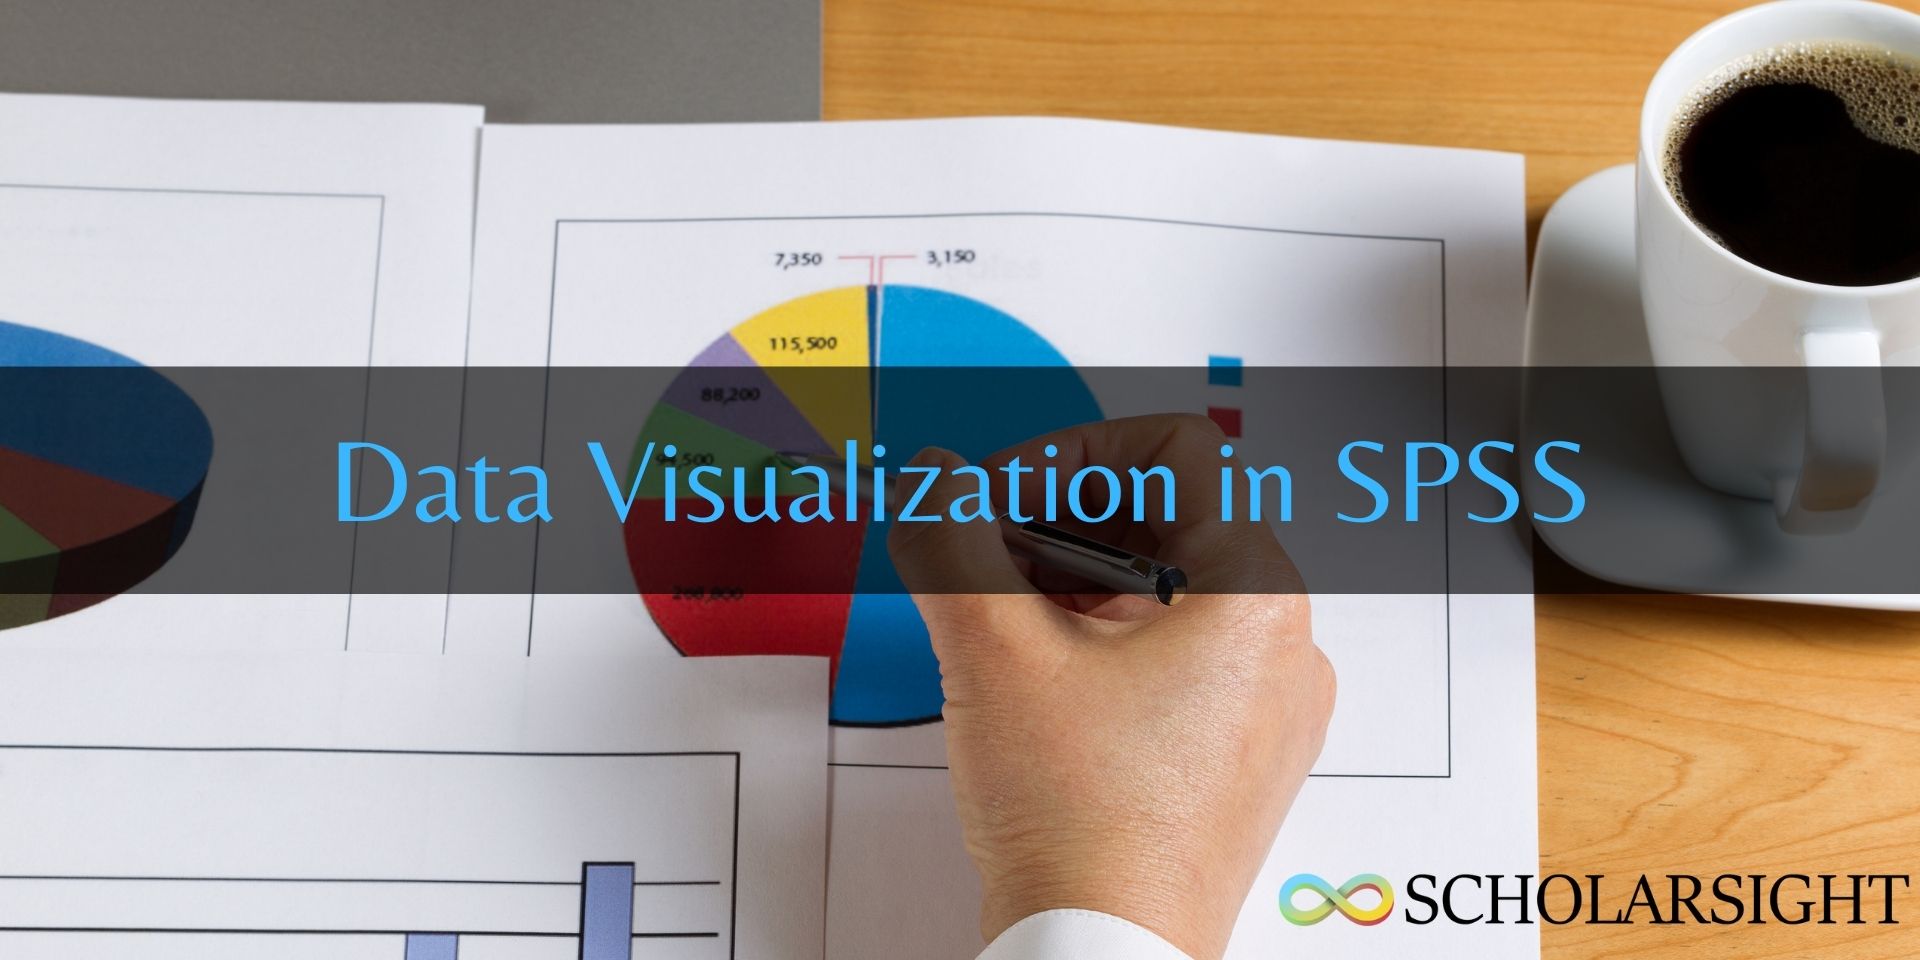
    This course, participants will learn how to use the latest tools and features in IBM SPSS to create a wide range of visualizations, including scatter plots, line charts, bar graphs, histograms, and more. They will also learn how to customize visualizations to better suit their needs, including changing colors, labels, fonts, and other design elements. In addition to learning technical skills, participants will also learn how to effectively communicate their insights through visualizations. This includes learning how to choose the right type of visualization for a given dataset, how to use storytelling techniques to guide the viewer through the data, and how to make their visualizations accessible to all audiences.

    Learning Outcomes

    On completion of this course you will be able to:

    • Analyse Advanced data for creating graphs and visualizations in SPSS with confidence
    • Perform suitable operations in SPSS for refining charts and diagrams
    • Plan and support test hypotheses with suitable charts and diagrams
    • Present your results supported by charts and diagrams in in standard format.

    Requirements

    • Familiarity with basic research process will be helpful but not essential.
    • A keen desire to master Statistics and SPSS
    • A laptop with internet connection
    • Familiarity with basic computer and operating system

    Recommended Foundation Course(s)

    Students are expected to be familiar with the following Foundation course(s) before going through this course:

    • IBM SPSS Statistics Foundation Course

    Questions and Answers

    Premium Members can post their course related questions and problems in Discussion Forum to get a response.

    Certification

    You will receive a course completion certificate after completion of the course.

    Related Courses

    IBM SPSS Statistics Foundation Course 04:88

    IBM SPSS Statistics Foundation Course

    Mar 30, 2020
    Regression Analysis Using SPSS 01:35

    Regression Analysis Using SPSS

    Jul 24, 2020
    Exploratory Factor Analysis in SPSS 02:54

    Exploratory Factor Analysis in SPSS

    Jul 24, 2020
    Chi-Square Statistic Using SPSS 00:40

    Chi-Square Statistic Using SPSS

    Jan 01, 2020
    Reliability Analysis Using SPSS 01:07

    Reliability Analysis Using SPSS

    Jan 01, 2020
    Data Visualization in SPSS 01:19

    Data Visualization in SPSS

    Jan 01, 2021
    Logistic Regression Using SPSS 02:59

    Logistic Regression Using SPSS

    Jan 01, 2020
    Moderation and Mediation Analysis using PROCESS in SPSS 03:03

    Moderation and Mediation Analysis using PROCESS in SPSS

    Jan 01, 2020
    General Linear Modelling 00:20

    General Linear Modelling

    Jan 01, 2020
    One-Way Repeated Measure ANOVA Using SPSS 02:35

    One-Way Repeated Measure ANOVA Using SPSS

    Jan 01, 2020
    Introduction to Correlations Using SPSS 02:16

    Introduction to Correlations Using SPSS

    Jan 01, 2020
    Measures of Association Using SPSS: Kendall's Tau 01:16

    Measures of Association Using SPSS: Kendall's Tau

    Jan 01, 2020
    One-Way Analysis of Covariance (ANCOVA) in SPSS 02:00

    One-Way Analysis of Covariance (ANCOVA) in SPSS

    Jan 01, 2020
    Multivariate Analysis of Variance (MANOVA) in SPSS 01:24

    Multivariate Analysis of Variance (MANOVA) in SPSS

    Jan 01, 2020
    SPSS Powerclass: Learn Advanced SPSS 01:43

    SPSS Powerclass: Learn Advanced SPSS

    Jan 21, 2023
    SPSS Powerclass: Learn SPSS from Advanced to Ultimate 05:51

    SPSS Powerclass: Learn SPSS from Advanced to Ultimate

    Jan 01, 2023
    Meta Analysis Using SPSS 00:35

    Meta Analysis Using SPSS

    May 01, 2023
    Turf Analysis in SPSS 01:22

    Turf Analysis in SPSS

    May 01, 2023
    Advanced Data Visualization in SPSS 01:22

    Advanced Data Visualization in SPSS

    May 01, 2023
    Survival Analysis Using SPSS 03:35

    Survival Analysis Using SPSS

    May 01, 2023

    Instructor

    Ritesh Chouhan
    Ritesh Chouhan

    Scholarsight is a Knowledge Organization. Our mission is to humanize scientific methods through technology-enabled learning. We are building Galaxy's biggest library of courses for scientists, inventors, and professionals.

    Want to learn from industry experts? Join today.
    Unlock this course with a membership upgrade
    logo
    • Pricing
    • Paths
    • Terms and Conditions
    • Privacy policy
    • Refund Policy
    • Cookie Policy
    • Disclaimer
    • Help Center and Support
    • Sitemap
    • About Us
    • Contact Us
    • Blog
    • Partners
    • Ideas & Events

    • Become an Instructor
    • Campus Partnership
    Copyright ©2025 SCHOLARSIGHT